
Hello Friends,
Today we’ll discuss correlation coefficient and few important methods to calculate correlation coefficient.
Before diving deep in correlation coefficient, let’s understand correlation. One can casually understand from the word, that it’s Co-Relation, which is exactly the purpose of correlation coefficient.
Correlation means the relation between 2 or more variables.
Now, here comes correlation coefficient.
Before discussing correlation coefficient, let us understand the purpose of finding correlation coefficient.
Use of Correlation Coefficient
In Machine Learning, we don’t directly apply machine learning algorithms. Before that, we work on data. There are hell lot of steps before that, applying machine learning algorithm, is just a small part of the whole journey.
Correlation Coefficient is used to determine the relationship between 2 variables. It’s used to understand, if 2 independent variables are correlated or not.
Now, if they are correlated, you may want to take some steps. It all depends on correlation coefficient.
Now, besides Machine Learning & data science also, correlation coefficient is used in various professions and fields, for example, portfolio management. In finance, we want to calculate the correlation between investment and assets.
Also, if we think logically, there are many ways we can think, in which we want to calculate the relationship between 2 variables.
But, one thing is common between all the use cases. That is, it includes data.
Now, enough of the use cases. Let’s jump to correlation coefficient.
Correlation Coefficient
Correlation Coefficient is a statistical measure, by which we can objectively determine the relationship between 2 data variables.
In statistics, there are various methods to determine correlation coefficient.
There are mainly 2 methods to determine correlation coefficient:
- Pearson Correlation Coefficient
- Spearman’s Rank Correlation Coefficient
Before discussing the above 2 methods, let us understand, what output we’ll get from these 2 methods.
Findings of Correlation Coefficient
Correlation Coefficient helps us with 2 findings: Strength of the relationship, Direction of the relationship.
Now, let us talk about both findings:
- Strength of the relationship:
Now, let us forget about sign and focus on the magnitude.
In Corelation Coefficient, 0 means no correlation and 1 means maximum correlation.
Now, let us try to understand with the help of a graph.
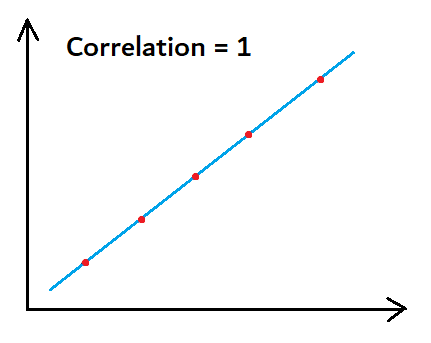
In the above graph, the correlation is 1, because all the data points are falling on the straight line itself, which means that these 2 variables are highly correlated.
Now, let us look at another graph,
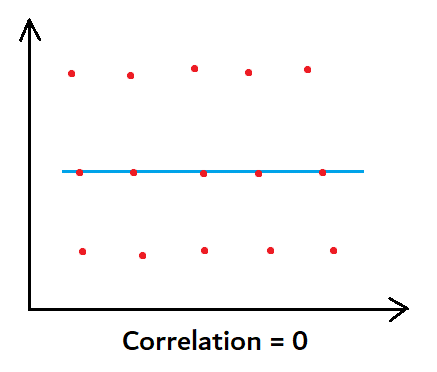
In the above graph, the correlation is 0, because height & Exam Scores are not related in any sense. No data point is falling on the line.
2. Direction of the relationship
Now, -1 means very strong negative correlation & 1 means very strong positive correlation.
Let us understand the meaning of positive correlation and negative correlation.
Basically, 2 variables are in positive correlation when 1 variable is increasing and other is also increasing.
Similarly, 2 variables are in negative correlation when 1 variable is increasing and other is decreasing. Now, since we have discussed the findings, let us discuss the methods to find correlation coefficient.
Pearson Correlation Coefficient
Pearson Correlation Coefficient is one of the most widely used methods to check correlation.
It is used to measure the relationship between 2 variables. But it’s used only when there’s linear relationship between 2 variables.
Formula for Person Correlation Coefficient
Below is the formula for calculating Pearson Correlation Coefficient. x & y are the variables.

In the above formula,
r = Pearson Correlation Coefficient
xi = ith value of the x-variable in the sample
yi = ith value of the y-variable in the sample
x̄ = Mean of the values of y-variable
ȳ = Mean of the values of x-variable
Now, if you look at the above formula, it is nothing but,

In the above formula,
ρ = Correlation Coefficient
cov(x,y) = co-variance of x & y
σx = standard deviation of x
σy = standard deviation of y
The Pearson Correlation Coefficient will have values between -1 to +1.
How to use Pearson Correlation Coefficient using Python
Now, since we all know numpy is a fantastic library. To calculate Pearson Correlation Coefficient, we just need to apply a function, i.e.
numpy.corrcoef()Below is the example:
# Import necessary libraries
import numpy as np

# Finding Pearson Correlation Coefficient
my_rho = np.corrcoef(x_sample_data, y_sample_data)
Assumptions of Pearson Correlation Coefficient
Now, before calculating Pearson Correlation Coefficient, we need to understand that this formula assumes 5 assumptions. These 5 assumptions need to be true, if we want to calculate correlation coefficient using this formula.
- Level of Measurement: Tow variables should be measured at interval or ration level.
- Linear Relationship: There should be linear relationship between 2 variables
- Normal Distribution: Both variables should roughly follow Normal Distribution
- Related Pairs: Each observation in the dataset should be pair of values
- No Outliers: There shouldn’t be any extreme outliers in the dataset
Limitations of Pearson Correlation Coefficient
Now, since we know the formula, it’s important to know that this formula has limitations.
The biggest limitation lies in one of the assumptions that 2 variables must be in the linear relationship.
Now, in real life, most of the time, 2 variables are not in the linear relationship. There are many factors which are there.
So, most of the time, we can’t use this formula. There are other limitations also, which can again come from the 5 big assumptions.
Spearman Rank Correlation Coefficient
Spearman Rank Correlation Coefficient is also one of the very widely used method to calculate correlation.
It’s used when there is a monotonous relation between 2 variables. Thereby, it removes the big limitation of Pearson Correlation Coefficient.
Formula for Spearman Rank Correlation Coefficient
Below is the formula for Spearman Rank Correlation Coefficient:

In the above formula,
‘ρ’ (rho) = Correlation coefficient
N = Number of observation
di = Difference between 2 ranks of each observation
Before moving forward, let me tell you that this formula is for ranked variables, which means that if you want to calculate correlation between 2 variables, you need to first rank the data & after that apply the formula.
How to Rank the Data?
Let’s take an example:
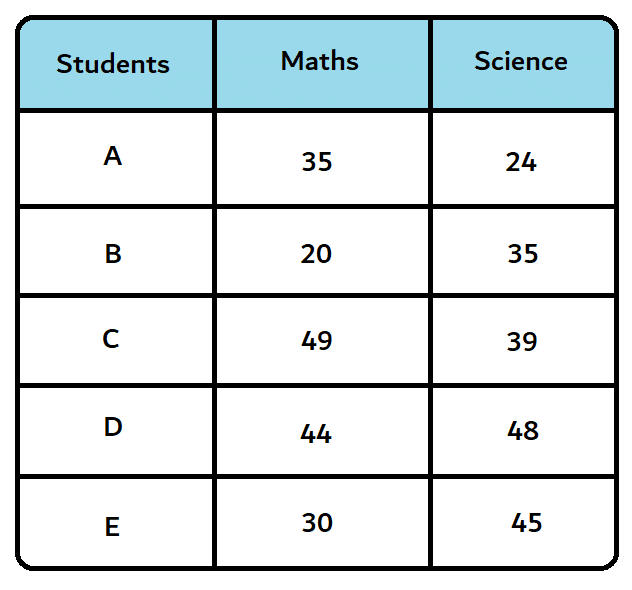
Now, we need to rank the data. We have 2 columns.
Step 1: We need to rank the data in decreasing order. Rank 1 will be assigned to highest marks and vice versa.
Step 2: Calculate the difference between the ranks (d) & their squared values (d^2).
If you follow the above steps, this kind of table should be formed.
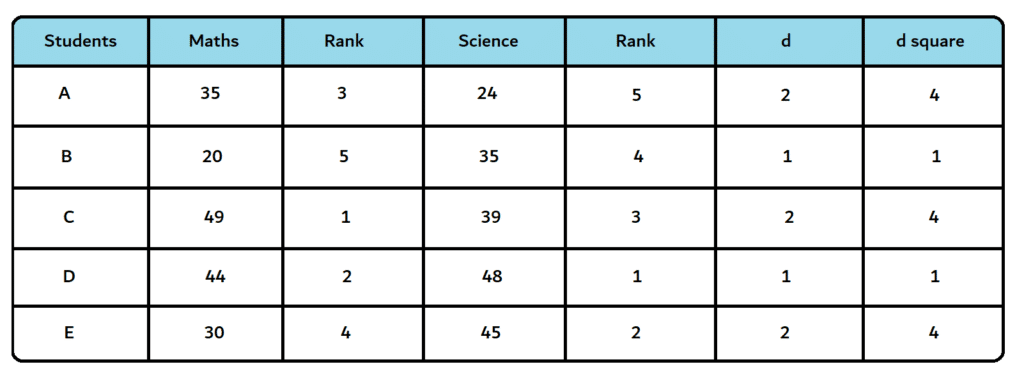
Now, since we have ranked the data, we can apply the formula.
Note that the above generated data is a sample example data.
Now, In real life, when you’ll use this algorithm in data science, If you’re thinking that you need to do all the ranking stuff by yourself, you are wrong. In fact, there is an inbuilt function in scipy library.
Below is the code:
# calculate the spearman's correlation between two variables
from scipy.stats import spearmanr

# calculate spearman's correlation
coef, p = spearmanr(data1, data2)
Limitations of Spearman Rank Correlation Coefficient
- This method cannot be used for finding out correlation in a grouped frequency distribution.
- It also can’t be used when the relation between 2 variables is non-monotonic.
So, this was all about the correlation Coefficient. We discussed 2 methods to calculate correlation coefficient.
I hope, I was able to explain properly. If you found something erroneous or If you’re not able to understand something, please comment below.
The next article will be out soon. Till then, stay tuned.
